
Limited Time Offer!
For Less Than the Cost of a Starbucks Coffee, Access All DevOpsSchool Videos on YouTube Unlimitedly.
Master DevOps, SRE, DevSecOps Skills!
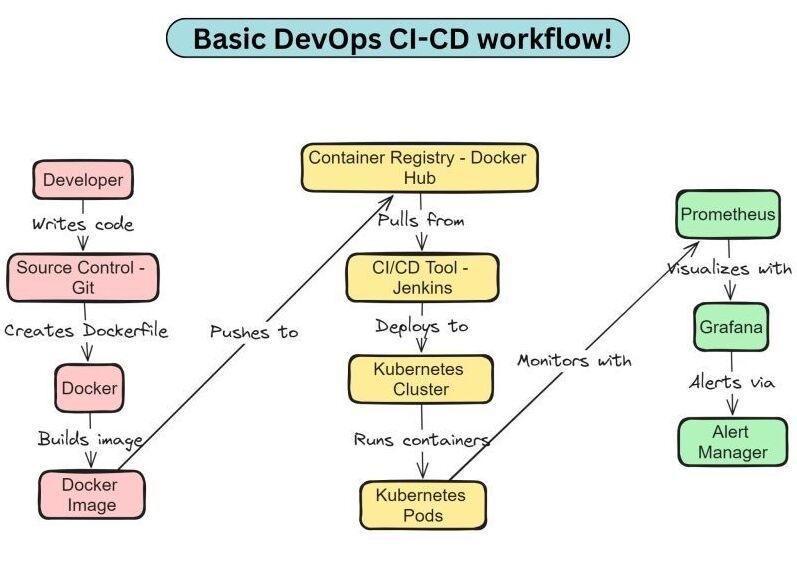
In the quickly changing world of software development, contemporary approaches such as DevOps have become critical for delivering high-quality products swiftly and reliably. This complete workflow explains the whole process of creating, producing, deploying, and monitoring an application with modern technologies and best practices. Using version control systems, containerization, continuous integration/continuous deployment (CI/CD), orchestration platforms, and monitoring tools, this pipeline provides seamless collaboration, scalability, and performance monitoring throughout the application lifetime. This introduction lays the groundwork for understanding each stage of the process, outlining how each tool and activity contributes to a strong and automated deployment pipeline.
1. Developer Writes Code
- The developer creates the program code, adds functionality, and fixes errors.
- Tools include Integrated Development Environments (IDEs), such as Visual Studio Code, IntelliJ IDEA, and any text editor.
- The purpose of this phase is to initiate the software lifecycle’s creation and development. The code written here is the foundation of the program.
2. Source Code (Git)
- The developer puts the code into a Git repository.
- Tools include Git systems such as GitHub, Bitbucket, and GitLab.
- Git repositories allow developers to log changes, revert to earlier versions, and interact with other team members. This guarantees that the code is managed consistently and cooperatively.
3. Creates Dockerfile
- Action: The developer builds a Dockerfile in the repository.
- Tools include text editors and integrated development environments.
- The Dockerfile is a script that contains a sequence of instructions for creating a Docker image. It defines the base image, application dependencies, environment variables, and instructions for running the program. This guarantees that the application may be produced and operated in a consistent environment.
4. Docker Builds Image
- Action: Docker reads the Dockerfile and creates a Docker image.
- Tools include Docker CLI and Docker Desktop.
- The Docker image is created according to the instructions in the Dockerfile. This image contains the application code, runtime, libraries, and configurations necessary to execute the application. The generated picture is a portable, stand-alone package.
5. Docker Image
- The output is a Docker image.
- Description: This image is a small, executable bundle of software that contains everything required to operate a program, including code, runtime, libraries, and settings. It guarantees that the program performs equally regardless of the environment.
6. Pushes to Container Registry
- Action: The Docker image is added to a container registry.
- Tools include container registries such as Docker Hub, JFrog Artifactory, and Google Container Registry.
- The container registry serves as a central repository for Docker images. Developers can now safely and effectively store, manage, and share Docker images.
7. Pulls from CI/CD Tool
- Action: A CI/CD tool retrieves the Docker image from the container registry.
- Tools include CI/CD tools such as Jenkins, GitLab CI, CircleCI, and Travis CI.
- The CI/CD tool automates the process of getting the most recent Docker image and preparing it for deployment. This guarantees that the most recent code changes are automatically tested, compiled, and delivered.
8. Deploys to Kubernetes Cluster
- The CI/CD tool will deploy the Docker image to a Kubernetes cluster.
- Tools: Kubernetes and kubectl (Kubernetes command-line tool).
- Kubernetes manages the deployment, scaling, and operation of containerized applications. It guarantees that the program runs across numerous nodes and can scale according to demand.
9. Runs Containers (Kubernetes Pods)
- The Docker image executes within Kubernetes pods.
- Kubernetes is a container management system.
- Pods are the smallest deployable components in Kubernetes. Each pod can have one or more containers that use the same network namespace and storage. This allows the application to function effectively while being controlled by Kubernetes.
10. Monitoring
- Action: A monitoring tool gathers and maintains metrics from running containers.
- Tools include Prometheus, Grafana, and the ELK Stack.
- Monitoring tools are used to track the performance and health of applications and Kubernetes clusters. This gives information on resource usage, application performance, and potential problems.
11. Visualizes with Grafana
- Grafana retrieves and visualizes metrics recorded by Prometheus.
- Grafana is a tool.
- Grafana’s purpose is to produce dashboards and visualizations to assist assess the application’s performance. This helps us study system behavior and detect performance bottlenecks or breakdowns.
12. Alerts via Alert Manager
- Action: The Alert Manager handles alerts based on preset criteria and provides notifications.
- Tools include Alert Manager, which is connected with Prometheus.
- Purpose: Alert Manager guarantees that any critical events or concerns in the application or infrastructure are quickly informed to the appropriate teams. This allows for faster reaction to possible problems, reducing downtime and preserving system dependability.
Summary
This process exemplifies a contemporary DevOps pipeline that prioritizes automation, scalability, and dependability. Using tools like as Git, Docker, Kubernetes, Prometheus, Grafana, and Alert Manager, developers may easily manage an application’s complete lifetime, from development to deployment and monitoring.